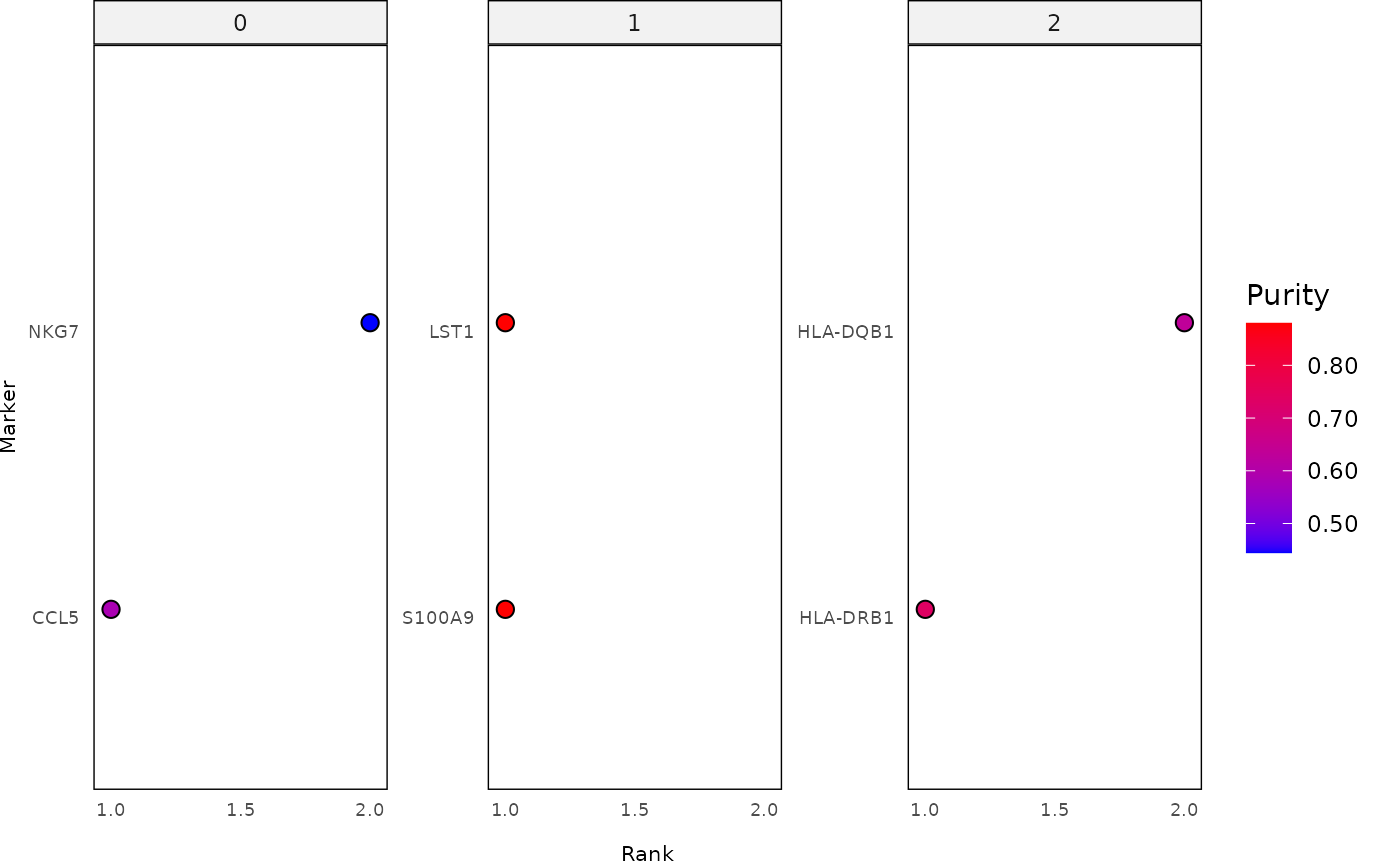
Generates a faceted dot plot for visualizing marker genes across clusters,
sub-clusters, or cell subsets stored in a ClustoCell or MarkoCell
object. Marker selection can be controlled by rank or by selecting the top
n markers per group. Dot size and color can represent marker purity
or marker class.
Usage
markoClustVis(
  obj,
  desired_sets = NULL,
  show_pos_markers = TRUE,
  show_neg_markers = FALSE,
  show_med_markers = FALSE,
  thresh_mode = c("n", "rank"),
  thresh = 5,
  title = NULL,
  subtitle = NULL,
  tag = NULL,
  nrow_panels = NULL,
  dotsize = 2,
  show_purity = TRUE,
  class_palette = NULL,
  color_low = "blue",
  color_high = "red",
  panel_border_color = "black",
  panel_border_size = 0.5,
  axis_text_size = 7,
  axis_title_size = 8,
  plot_margin_right = 10,
  xlab = "Rank",
  ylab = "Marker",
  show_legend = TRUE,
  legend_box = "vertical",
  legend_box_just = "left",
  legend_position = "right"
)
Arguments
- obj
An object of class
ClustoCellorMarkoCellcontaining marker information.- desired_sets
Optional character vector specifying the names of clusters, sub-clusters, and/or cell subsets to include. If
NULL, all available sets inobjare used.- show_pos_markers
Logical; whether to include positive markers. Default is
TRUE.- show_neg_markers
Logical; whether to include negative markers. Default is
FALSE.- show_med_markers
Logical; whether to include medium markers. Default is
FALSE.- thresh_mode
Character; method for selecting top markers. One of:
"rank": include all markers up to the specified rank threshold."n": include exactly the topnmarkers.
- thresh
Integer; threshold for selecting markers based on
thresh_mode. Default is5.- title
Optional character string for the plot title.
- subtitle
Optional character string for the plot subtitle.
- tag
Optional character string for the plot tag.
- nrow_panels
Optional integer specifying the number of rows in the faceted plot. If
NULL, rows are determined automatically.- dotsize
Numeric; size of the dots in the plot. Default is
2.- show_purity
Logical; if
TRUE, dot color represents marker purity. IfFALSE, dot color represents marker class. Default isTRUE.- class_palette
Optional palette used when
show_purity = FALSE. Can be either:A
ggplot2scale object (e.g.,ggplot2::scale_fill_hue())A character vector of colors
- color_low
Character; low color for gradient (used when
show_purity = TRUE). Default is"blue".- color_high
Character; high color for gradient (used when
show_purity = TRUE). Default is"red".- panel_border_color
Character; color of panel borders.
- panel_border_size
Numeric; size of panel borders.
- axis_text_size
Numeric; font size for axis text.
- axis_title_size
Numeric; font size for axis titles.
- plot_margin_right
Numeric; right margin of the plot.
- xlab
Character; label for the x-axis. Default is
"Rank".- ylab
Character; label for the y-axis. Default is
"Marker".- show_legend
Logical; whether to display the legend. Default is
TRUE.- legend_box
Character; layout of the legend box (e.g.,
"vertical").- legend_box_just
Character; justification of the legend box.
- legend_position
Character; position of the legend (e.g.,
"right").
Value
A ggplot2 object showing a faceted dot plot of selected markers
across clusters, sub-clusters, or cell subsets.
Details
This function provides a flexible visualization for exploring marker genes identified in clustering analyses. Marker selection can be based on rank or a fixed number of top markers. The resulting plot is faceted by cluster or subset, enabling comparison across groups.
When show_purity = TRUE, a continuous color scale is used to represent
marker purity. Otherwise, discrete colors are used to represent marker classes
(e.g., positive, negative, medium).
Examples
utils::data("pbmc_small", package = "SeuratObject")

pbmc_small$example_clusters <- as.character(
  SeuratObject::Idents(pbmc_small)
)

cc <- markoClust(
  data = pbmc_small,
  cluster_labels = "example_clusters",
  identify_subclusters = FALSE,
  num_threads = 1,
  verbose = FALSE
)

plt <- markoClustVis(
  obj = cc,
  show_pos_markers = TRUE,
  show_neg_markers = FALSE,
  thresh_mode = "n",
  thresh = 2
)
#> ℹ Since `desired_sets` is not specified, the top markers of all clusters/cell subsets of `obj` will be visualized!

plt
#> Bin width defaults to 1/30 of the range of the data. Pick better value with
#> `binwidth`.