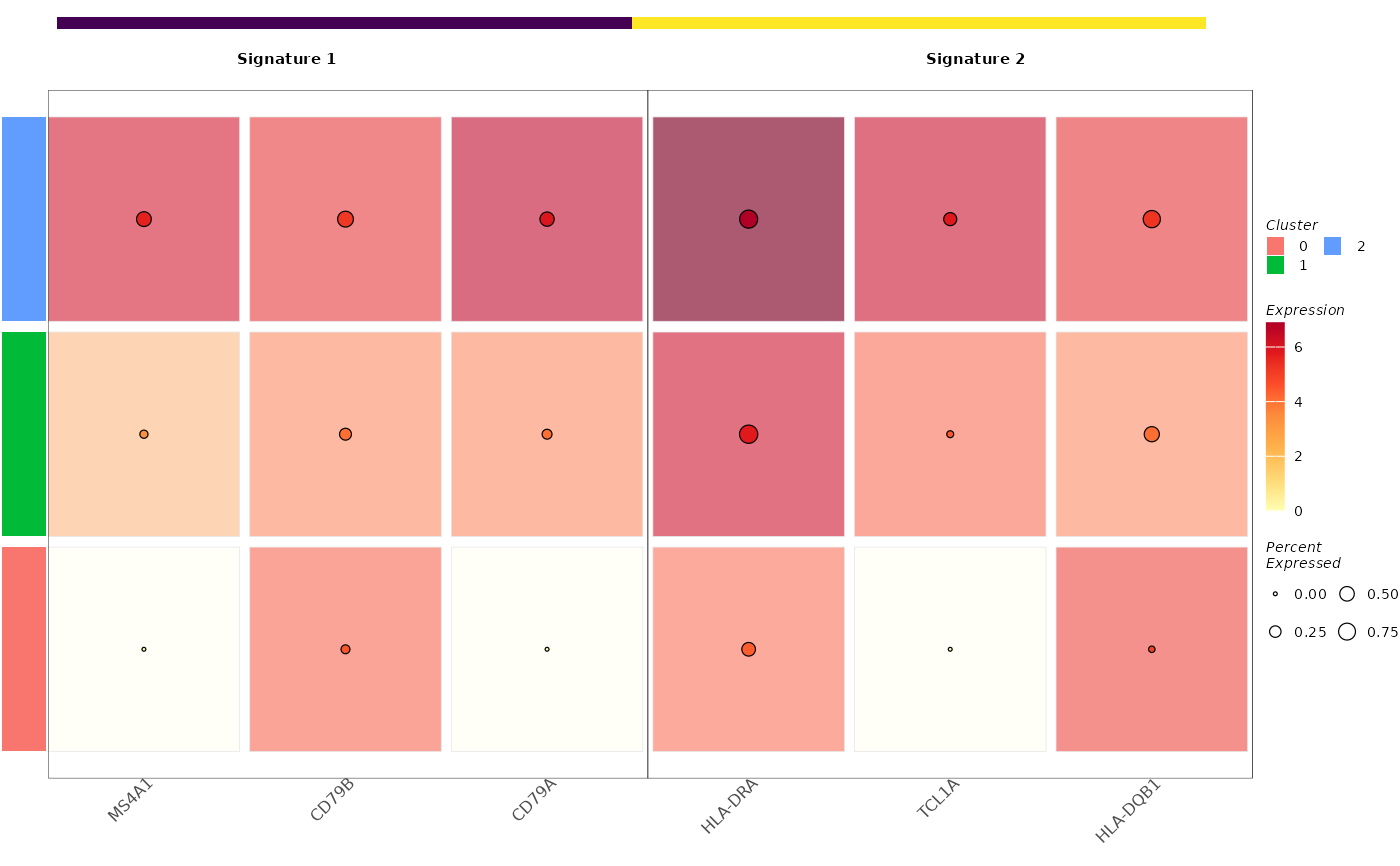
Visualize per-signature marker expression across clusters
Source:R/signatureDotHeatmap.R
signatureDotHeatmap.RdGenerates a dot heatmap summarizing expression of signature-associated features across clusters.
Usage
signatureDotHeatmap(
  seurat_obj,
  cluster_col,
  row_data,
  features_col = NULL,
  signature_col = NULL,
  cell_type_colors = NULL,
  signature_colors = NULL,
  tag = NULL,
  tile_palette = RColorBrewer::brewer.pal(9, "YlOrRd"),
  tile_alpha_range = c(0.15, 0.65),
  dot_size_factor = 2,
  dot_range = c(0.5, 3),
  signature_label_size = 3.3,
  feature_label_size = 6,
  feature_label_angle = 45,
  show_cluster_labels = FALSE,
  show_signature_strip = TRUE,
  show_signature_labels = TRUE,
  show_cluster_strip = TRUE,
  show_cluster_legend = TRUE,
  show_signature_legend = FALSE,
  legend_ncol = 2,
  expression_legend_title = "Expression",
  percent_legend_title = "Percent\nExpressed",
  tile_fill_legend_title = NULL,
  signature_legend_title = "Signature",
  vline_color = "black",
  vline_width = 0.15,
  block_border_color = "grey90",
  feature_label_face = "plain"
)
Arguments
- seurat_obj
A
Seuratobject containing expression data and metadata.- cluster_col
Character; column in
seurat_obj@meta.datacontaining cluster labels. These could correspond to user defined clusters or cell types.- row_data
Data frame mapping features to signatures. Must contain one row per feature.
- features_col
Character; column in
row_datacontaining feature (e.g. gene) IDs corresponding to the row names of theseurat_obj.- signature_col
Character; column in
row_datacontaining signature labels.- cell_type_colors
Color specification for cell types.
- signature_colors
Color specification for signatures.
- tag
Optional plot tag.
- tile_palette
Character vector defining tile fill colors.
- tile_alpha_range
Numeric vector of length two defining alpha range.
- dot_size_factor
Numeric; scaling factor for dot sizes.
- dot_range
Numeric vector defining minimum and maximum dot sizes.
- signature_label_size
Numeric; font size of signature labels.
- feature_label_size
Numeric; font size of feature labels.
- feature_label_angle
Numeric; angle of feature labels.
- show_cluster_labels
Logical; whether to show cluster labels.
- show_signature_strip
Logical; whether to show signature strip.
- show_signature_labels
Logical; whether to show signature labels.
- show_cluster_strip
Logical; whether to show cluster strip.
- show_cluster_legend
Logical; whether to show cluster legend.
- show_signature_legend
Logical; whether to show signature legend.
- legend_ncol
Integer; number of legend columns.
- expression_legend_title
Character; title for expression legend.
- percent_legend_title
Character; title for percent expressed legend.
- tile_fill_legend_title
Character; title for tile fill legend.
- signature_legend_title
Character; title for signature legend.
- vline_color
Character; color of vertical separator lines.
- vline_width
Numeric; width of vertical separator lines.
- block_border_color
Character; color of block borders.
- feature_label_face
Character; font face for feature labels.
Details
Dot size typically encodes the percentage of cells expressing a feature, while color intensity reflects average expression.
Examples
utils::data("pbmc_small", package = "SeuratObject")

pbmc_small$example_clusters <- as.character(
  SeuratObject::Idents(pbmc_small)
)

features <- rownames(pbmc_small)[1:6]

signatures <- data.frame(
  Features = features,
  Signature = rep(
    c("Signature 1", "Signature 2"),
    each = 3
  )
)

p <- signatureDotHeatmap(
  seurat_obj = pbmc_small,
  cluster_col = "example_clusters",
  row_data = signatures,
  features_col = "Features",
  signature_col = "Signature"
)

p