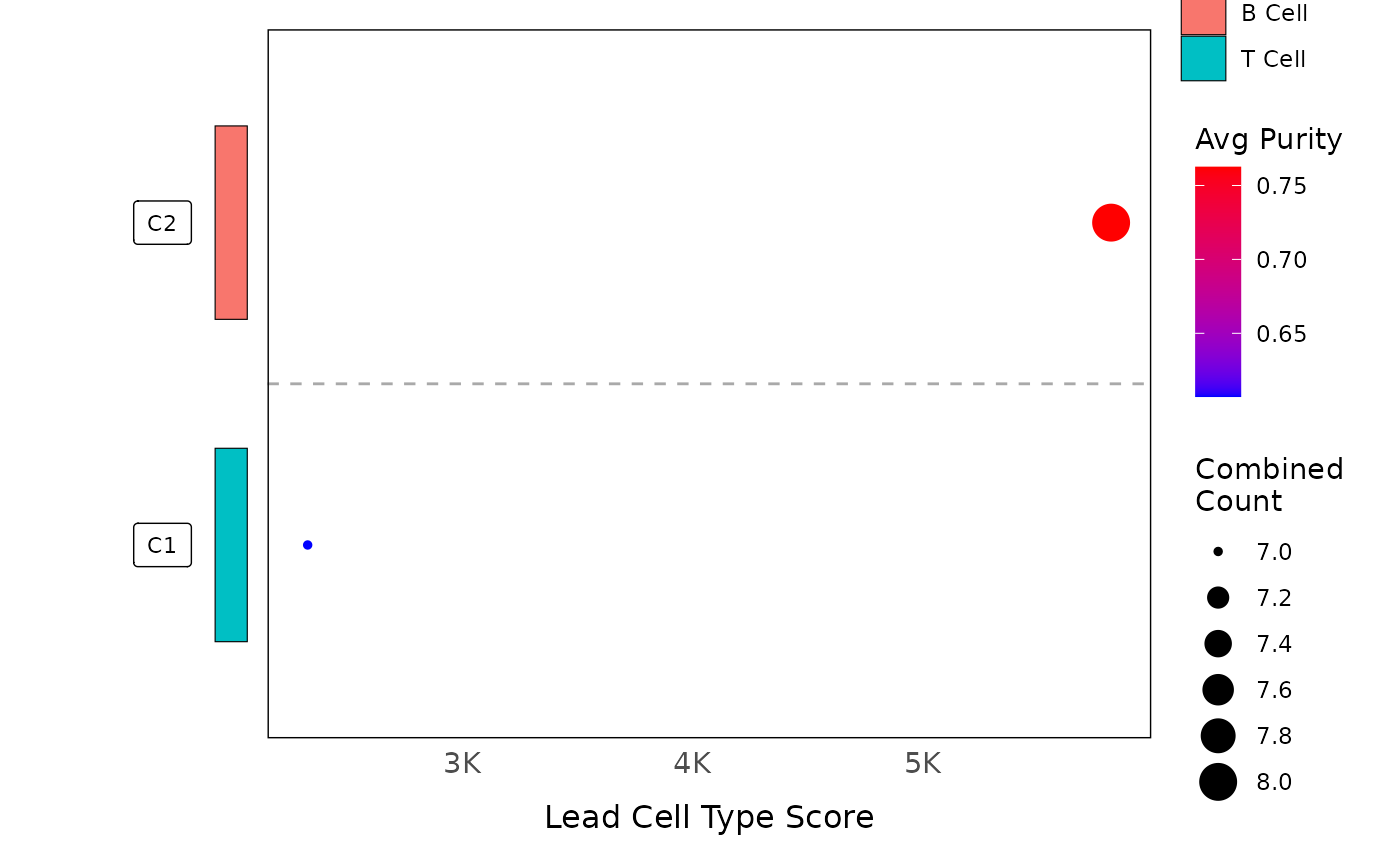
Visualizes cell-type annotation results generated by typoClust() using
a composite layout combining label, tile, and dot plots.
Usage
typoClustVis(
  typoClust,
  desired_sets = NULL,
  rank_thresh = 1,
  refine = TRUE,
  refine_thresh = 1,
  order_by = c("Cell Type", "Cluster", "Combined Score", "Combined Count", "Purity"),
  title = NULL,
  subtitle = NULL,
  tag = NULL,
  cellType_palette = NULL,
  flip = FALSE,
  tile_width = 0.2,
  tile_height = 0.6,
  tile_xlim = c(0.5, 1.5),
  tile_legend_title = "Cell Type",
  dot_color_low = "blue",
  dot_color_high = "red",
  dot_panel_border_color = "black",
  dot_panel_border_size = 0.5,
  dot_axis_text_size = 11,
  dot_axis_title_size = 12,
  dot_plot_margin_right = 10,
  dot_xlab = "Lead Cell Type Score",
  dot_size_title = "Combined\nCount",
  dot_color_title = "Avg Purity",
  label_size = 3,
  label_padding_lines = 0.5,
  legend_box = "vertical",
  legend_box_just = "left",
  legend_position = "right"
)
Arguments
- typoClust
An object of class
TypoClustgenerated bytypoClust().- desired_sets
Optional character vector specifying which clusters, sub-clusters, or cell subsets to visualize. If
NULL, all sets intypoClustare shown.- rank_thresh
Integer specifying the top N ranked cell types to display per set.
- refine
Logical; whether to refine annotations by traversing deeper into the cell-type hierarchy.
- refine_thresh
Integer specifying how many hierarchical levels to traverse when refining cell types. Ignored if
refine = FALSE.- order_by
Character string specifying how to order clusters in the plot. One of
"Cell Type","Cluster","Combined Score","Combined Count", or"Purity".- title
Optional character string specifying the plot title.
- subtitle
Optional character string specifying the plot subtitle.
- tag
Optional character string specifying a plot tag.
- cellType_palette
A scale specification for coloring cell types. Can be either a ggplot2 scale object (e.g.
ggplot2::scale_fill_hue()) or a character vector of colors.- flip
Logical; whether to flip plot axes.
- tile_width
Numeric specifying tile width.
- tile_height
Numeric specifying tile height.
- tile_xlim
Numeric vector of length two specifying x-axis limits for tile plots.
- tile_legend_title
Character string specifying the tile legend title.
- dot_color_low
Character string specifying the low-end color of the dot color scale.
- dot_color_high
Character string specifying the high-end color of the dot color scale.
- dot_panel_border_color
Character string specifying the border color of dot panels.
- dot_panel_border_size
Numeric specifying the border line width of dot panels.
- dot_axis_text_size
Numeric specifying axis text size in the dot plot.
- dot_axis_title_size
Numeric specifying axis title size in the dot plot.
- dot_plot_margin_right
Numeric specifying the right margin of the dot plot.
- dot_xlab
Character string specifying the x-axis label for the dot plot.
- dot_size_title
Character string specifying the dot size legend title.
- dot_color_title
Character string specifying the dot color legend title.
- label_size
Numeric specifying label text size.
- label_padding_lines
Numeric specifying vertical padding between labels.
- legend_box
Character string specifying legend box orientation.
- legend_box_just
Character string specifying legend box justification.
- legend_position
Character string specifying legend position.
Details
typoClustVis() displays the top-ranked cell types per cluster or
cell subset, optionally refining annotations to deeper hierarchical levels.
The visualization integrates categorical labels, quantitative annotation
scores, marker support, and purity metrics.
Examples
utils::data("pbmc_small", package = "SeuratObject")

cc <- clustoCell(
  data = pbmc_small,
  identify_subclusters = FALSE,
  num_threads = 1,
  verbose = FALSE
)

desired_sets <- utils::head(
  sort(unique(as.character(cc$clusters$major_clusters))),
  2
)

tc <- typoClust(
  objects = list(cc),
  desired_sets = desired_sets,
  tissue = "Blood",
  condition = "Healthy",
  use_neg_markers = FALSE,
  thresh = 10,
  mode = "markerDB",
  species = "human",
  verbose = FALSE
)

p <- typoClustVis(
  typoClust = tc,
  rank_thresh = 1,
  refine = FALSE,
  order_by = "Cluster"
)
#> ℹ Since `desired_sets` is NULL, all clusters and cell subsets will be visualized!

p